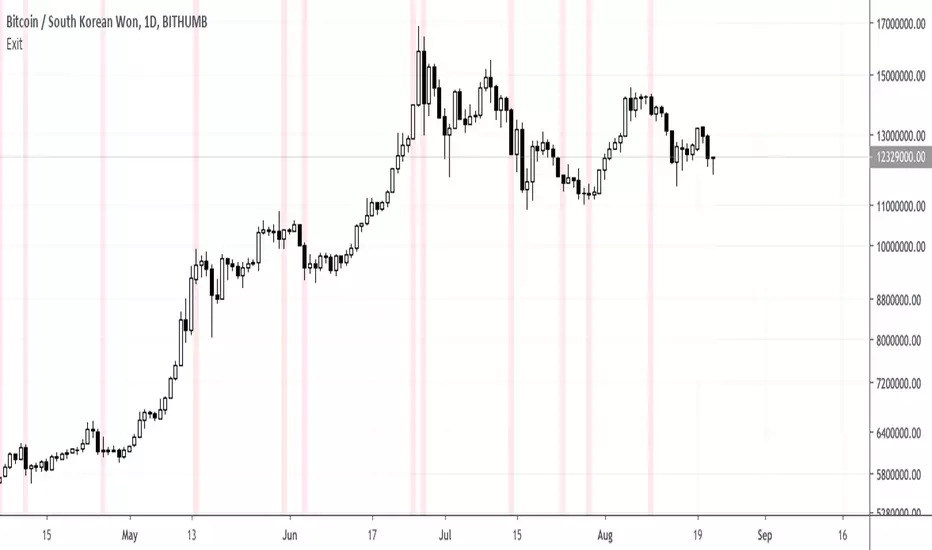
Super Exit indicators [대탈출지표]I use RVI, RSI, MACD, AROON to decide where to exit.
Check it out which one is right to you
RVI : relative vigor index
- exit signal when crossunder
RSI
- You can choose the trigger value, default is 70
- You can also choose the trigger option, crossover or crossunder
MACD
- Exit signal is generated when crossunder
Aroon
- Exit signal is generated when Up is under 50 and Down is over 50
Cari dalam skrip untuk "RSI MACD"
Divergence RSI STOCH MACD CCI OBV CMF [PlungerMen]
Indicators seek divergence of prices
It graphs a few lines showing the divergence or convergence of the market
take signals from RSI, MACD, MACD Histogram, Stochastic, CCI, Momentum, OBV, Diosc, VWMACD and CMF
you can choose to take individual signal signals
** that's test versio n** have many not exactly =))
i will update soon when solving the algorithm

PpSignal RSI MACD Adaptive Trima MA Just a simple MACD (Moving Aveage Convergence Divergence) indicator made of RSI, calc with TRIMA Moving Average, but this time with adaptive period for the moving averages.
As usual, you can play with settings to find your best parameters to your own trading style.
Converted from a MQL4 version to prorealtime, by a request in the Spanish forum.


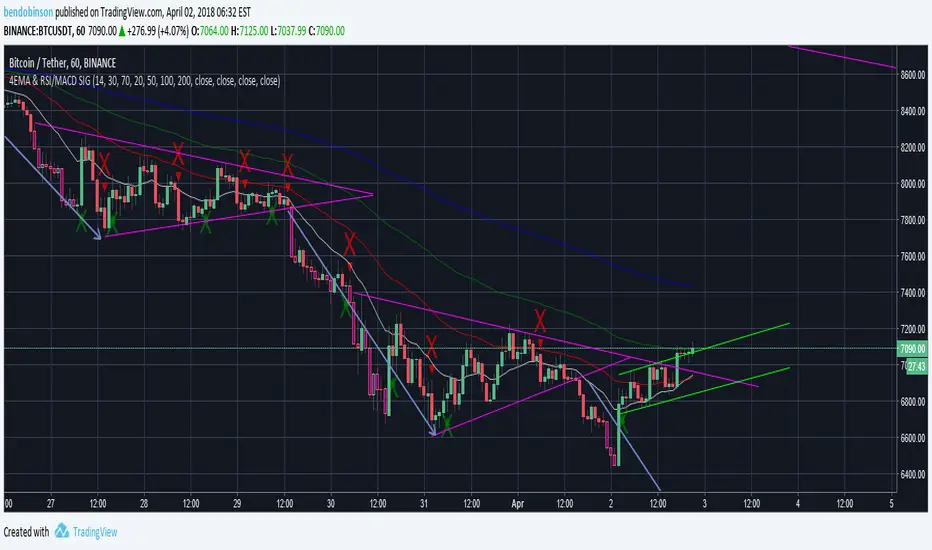
BD 4EMA RSI/MACD SIGNAL V1this chart allows 4 moving averages and gives a signal for macd cross over up and down as well as RSI oversold - purple - and overbought -yellow - all in 1 indicator.
Multi Signal RSI MACD Gann buy ans sell signal zwith RSI, zerollagMacd and highLow Gann and & indicator Macd head band Bollinger & SMA

📊 Smart Box Level with Technical Table and RSI LabelConsists of:
1. Smart Box Level (Equilibrium Box)
2. Technical Indicator Table
3. RSI Label
Indicator Function:
Box Section → visualizes volume-based price equilibrium zones (dynamic support/resistance).
Table Section → summarizes multiple indicators (RSI, MACD, Stochastic, EMA, Bull/Bear power).
RSI Label → indicates significant momentum on the chart.
Alert → automatically signals if the box changes trend.
⚡ So, this indicator combines price-volume equilibrium (box) + classic technical indicators (table) + momentum signal (RSI label) → suitable for analyzing the combination of accumulation zones + technical confirmation.

Market Pulse Lite (RSI+MACD+EMAs+Vol+BTC.D+DXY)To use with de RSI 4h Strategy by M. Lolas, to confirm by and sell in the RSI range 4H. Make sense.

AI's Opinion Trading System V21. Complete Summary of the Indicator Script
AI’s Opinion Trading System V2 is an advanced, multi-factor trading tool designed for the TradingView platform. It combines several technical indicators (moving averages, RSI, MACD, ADX, ATR, and volume analysis) to generate buy, sell, and hold signals. The script features a customizable AI “consensus” engine that weighs multiple indicator signals, applies user-defined filters, and outputs actionable trade instructions with clear stop loss and take profit levels. The indicator also tracks sentiment, volume delta, and allows for advanced features like pyramiding (adding to positions), custom stop loss/take profit prices, and flexible signal confirmation logic. All key data and signals are displayed in a dynamic, color-coded table on the chart for easy review.
2. Full Explanation of the Table
The table is a real-time dashboard summarizing the indicator’s logic and recommendations for the most recent bars. It is color-coded for clarity and designed to help traders quickly understand market conditions and AI-driven trade signals.
Columns (from left to right):
Column Name What it Shows
Bar The time context: “Now” for the current bar, then “Bar -1”, “Bar -2”, etc. for previous bars.
Raw Consensus The raw AI consensus for each bar: “Buy”, “Sell”, or “-” (neutral).
Up Vol The amount of volume on up (rising) bars.
Down Vol The amount of volume on down (falling) bars.
Delta The difference between up and down volume. Green if positive, red if negative, gray if neutral.
Close The closing price for each bar, color-coded by price change.
Sentiment Diff The difference between the close and average sentiment price (a custom sentiment calculation).
Lookback The number of bars used for sentiment calculation (if enabled).
ADX The ADX value (trend strength).
ATR The ATR value (volatility measure).
Vol>Avg “Yes” (green) if volume is above average, “No” (red) otherwise.
Confirm Whether the AI signal is confirmed over the required bars.
Logic Output The AI’s interpreted signal after applying user-selected logic: “Buy”, “Sell”, or “-”.
Final Action The final signal after all filters: “Buy”, “Sell”, or “-”.
Trade Instruction A plain-English instruction: Buy/Sell/Add/Hold/No Action, with price, stop loss, and take profit.
Color Coding:
Green: Positive/bullish values or signals
Red: Negative/bearish values or signals
Gray: Neutral or inactive
Blue background: For all table cells, for visual clarity
White text: Default, except for color-coded cells
3. Full User Instructions for Every Input/Style Option
Below are plain-language instructions for every user-adjustable option in the indicator’s input and style pages:
Inputs
Table Location
What it does: Sets where the summary table appears on your chart.
How to use: Choose from 9 positions (Top Left, Top Center, Top Right, etc.) to avoid overlapping with other chart elements.
Decimal Places
What it does: Controls how many decimal places prices and values are displayed with.
How to use: Increase for assets with very small prices (e.g., SHIB), decrease for stocks or forex.
Show Sentiment Lookback?
What it does: Shows or hides the “Lookback” column in the table, which displays how many bars are used in the sentiment calculation.
How to use: Turn off if you want a simpler table.
AI View Mode
What it does: Selects the logic for how the AI combines signals from different indicators.
Majority: Follows the most common signal among all indicators.
Weighted: Uses custom weights for each type of signal.
Custom: Lets you define your own logic (see below).
How to use: Pick the logic style that matches your trading philosophy.
AI Consensus Weight / Vol Delta Weight / Sentiment Weight
What they do: When using “Weighted” AI View Mode, these let you set how much influence each factor (indicator consensus, volume delta, sentiment) has on the final signal.
How to use: Increase a weight to make that factor more important in the AI’s decision.
Custom AI View Logic
What it does: Lets advanced users write their own logic for when the AI should signal a trade (e.g., “ai==1 and delta>0 and sentiment>0”).
How to use: Only use if you understand basic boolean logic.
Use Custom Stop Loss/Take Profit Prices?
What it does: If enabled, you can enter your own fixed stop loss and take profit prices for buys and sells.
How to use: Turn on to override the auto-calculated SL/TP and enter your desired prices below.
Custom Buy/Sell Stop Loss/Take Profit Price
What they do: If custom SL/TP is enabled, these fields let you set exact prices for stop loss and take profit on both buy and sell trades.
How to use: Enter your preferred price, or leave at 0 for auto-calculation.
Sentiment Lookback
What it does: Sets how many bars the sentiment calculation should look back.
How to use: Increase to smooth out sentiment, decrease for faster reaction.
Max Pyramid Adds
What it does: Limits how many times you can add to an existing position (pyramiding).
How to use: Set to 1 for no adds, higher for more aggressive scaling in trends.
Signal Preset
What it does: Quick-sets a group of signal parameters (see below) for “Robust”, “Standard”, “Freedom”, or “Custom”.
How to use: Pick a preset, or select “Custom” to adjust everything manually.
Min Bars for Signal Confirmation
What it does: Sets how many bars a signal must persist before it’s considered valid.
How to use: Increase for more robust, less frequent signals; decrease for faster, but possibly less reliable, signals.
ADX Length
What it does: Sets the period for the ADX (trend strength) calculation.
How to use: Longer = smoother, shorter = more sensitive.
ADX Trend Threshold
What it does: Sets the minimum ADX value to consider a trend “strong.”
How to use: Raise for stricter trend confirmation, lower for more trades.
ATR Length
What it does: Sets the period for the ATR (volatility) calculation.
How to use: Longer = smoother volatility, shorter = more reactive.
Volume Confirmation Lookback
What it does: Sets how many bars are used to calculate the average volume.
How to use: Longer = more stable volume baseline, shorter = more sensitive.
Volume Confirmation Multiplier
What it does: Sets how much current volume must exceed average volume to be considered “high.”
How to use: Increase for stricter volume filter.
RSI Flat Min / RSI Flat Max
What they do: Define the RSI range considered “flat” (i.e., not trending).
How to use: Widen to be stricter about requiring a trend, narrow for more trades.
Style Page
Most style settings (such as plot colors, label sizes, and shapes) are preset in the script for visual clarity.
You can adjust plot visibility and colors (for signals, stop loss, take profit) in the TradingView “Style” tab as with any indicator.
Buy Signal: Shows as a green triangle below the bar when a buy is triggered.
Sell Signal: Shows as a red triangle above the bar when a sell is triggered.
Stop Loss/Take Profit Lines: Red and green lines for SL/TP, visible when a trade is active.
SL/TP Labels: Small colored markers at the SL/TP levels for each trade.
How to use:
Toggle visibility or change colors in the Style tab if you wish to match your chart theme or preferences.
In Summary
This indicator is highly customizable—you can tune every aspect of the AI logic, risk management, signal filtering, and table display to suit your trading style.
The table gives you a real-time, comprehensive view of all relevant signals, filters, and trade instructions.
All inputs are designed to be intuitive—hover over them in TradingView for tooltips, or refer to the explanations above for details.

Sri_Momentum Burst Histogram📝 Description :
🌀 Sri_Momentum Burst Histogram — A Custom Momentum and Volatility Fusion Tool
The Sri_Momentum Burst Histogram is a unique technical analysis tool designed to visualize sudden changes in price momentum in the form of a dynamic, color-coded histogram. This indicator helps traders identify trend accelerations, early momentum shifts, and potential exhaustion in real time.
By combining a MACD-like momentum engine with a volatility-sensitive Bollinger Band range, this script offers an enhanced view of market bursts — moments where momentum "pops" beyond typical ranges. The result is a refined perspective on market sentiment, helping traders to anticipate reversals, follow breakouts, and assess the relative strength of ongoing trends.
🧠 Core Methodology
The indicator calculates the difference between a fast and slow EMA (Exponential Moving Average), similar to a MACD histogram.
This difference is then compared across candles to gauge the rate of change in momentum — referred to here as a “momentum burst.”
A sensitivity multiplier allows you to scale the response based on your preferred timeframe and trading style.
A volatility band, derived from Bollinger Band logic, is used to frame the relative intensity of the momentum change.
The histogram is divided into two parts:
Green/Lime Bars represent increasing and decreasing bullish momentum.
Red/Orange Bars represent increasing and decreasing bearish momentum.
⚙️ Customizable Inputs
Momentum Sensitivity: Adjust the responsiveness of the burst detection mechanism.
Short EMA Period: Sets the lookback period for the fast EMA.
Long EMA Period: Sets the lookback period for the slow EMA.
Volatility Band Length: Controls the length used for Bollinger Band calculations.
Band Std Dev Multiplier: Adjusts how wide the volatility range should be, based on price dispersion.
📈 How to Use It
Use the green/red histogram bars to visually gauge momentum strength and direction.
Watch for transitions in color intensity (e.g., green to lime, red to orange) as early warning signs of trend exhaustion or reversal.
Combine with other indicators like RSI, MACD, ADX, or volume profiles to confirm entry/exit points.
Useful in both trending and ranging markets, especially on lower timeframes for scalping or intraday setups.
✅ Key Features
Easy-to-read histogram with intuitive color coding.
Fully customizable settings for fine-tuned signal control.
Can be used on any asset class — stocks, forex, crypto, commodities.
Optimized for real-time use with minimal lag.
🔐 This script is an original creation, developed independently by adapting publicly known mathematical concepts into a unique visualization tool. All function and variable names have been customized for originality and compliance with TradingView’s publishing and community standards.
💡 Developed by: @venkat_27
🧩 For educational purposes only — not financial advice.

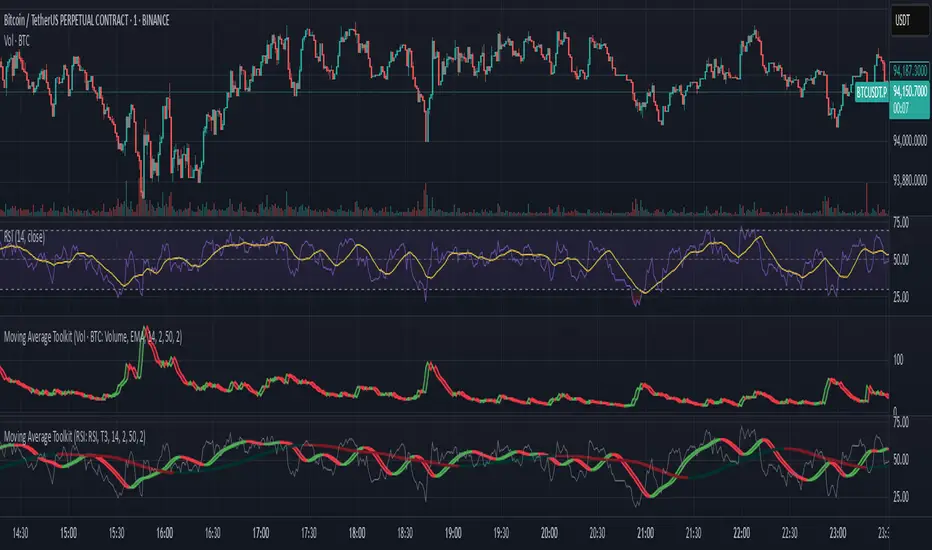
Moving Average ToolkitMoving Average Toolkit - Advanced MA Analysis with Flexible Source Input
A powerful and versatile moving average indicator designed for maximum flexibility. Its unique source input feature allows you to analyze moving averages of ANY indicator or price data, making it perfect for creating custom combinations with RSI, Volume, OBV, or any other technical indicator.
Key Features:
• Universal Source Input:
- Analyze moving averages of any data: Price, Volume, RSI, MACD, Custom Indicators
- Perfect for creating advanced technical setups
- Identify trends in any technical data
• 13 Moving Average Types:
- Traditional: SMA, EMA, WMA, RMA, VWMA
- Advanced: HMA, T3, DEMA, TEMA, KAMA, ZLEMA, McGinley, EPMA
• Dual MA System:
- Compare two different moving averages
- Independent settings for each MA
- Perfect for multiple timeframe analysis
• Visual Offset Analysis:
- Dynamic color changes based on momentum
- Fill between current and offset values
- Clear visualization of trend strength
Usage Examples:
• Price Trend: Traditional MA analysis using price data
• Volume Trend: Apply MA to volume for volume trend analysis
• RSI Trend: Smooth RSI movements for clearer signals
• Custom: Apply to any indicator output for unique insights
Settings:
• Fully customizable colors for bull/bear conditions
• Adjustable offset periods
• Independent length settings
• Optional second MA for comparison
Perfect for:
• Advanced technical analysts
• Multi-indicator strategy developers
• Custom indicator creators
• Traders seeking flexible analysis tools
This versatile toolkit goes beyond traditional moving averages by allowing you to apply sophisticated MA analysis to any technical data, creating endless possibilities for custom technical analysis strategies.
Global M2 Index Percentage### **Global M2 Index Percentage**
**Description:**
The **Global M2 Index Percentage** is a custom indicator designed to track and visualize the global money supply (M2) in a normalized percentage format. It aggregates M2 data from major economies (e.g., the US, EU, China, Japan, and the UK) and adjusts for exchange rates to provide a comprehensive view of global liquidity. This indicator helps traders and investors understand the broader macroeconomic environment, identify trends in money supply, and make informed decisions based on global liquidity conditions.
---
### **How It Works:**
1. **Data Aggregation**:
- The indicator collects M2 data from key economies and adjusts it using exchange rates to calculate a global M2 value.
- The formula for global M2 is:
\
2. **Normalization**:
- The global M2 value is normalized into a percentage (0% to 100%) based on its range over a user-defined period (default: 13 weeks).
- The formula for normalization is:
\
3. **Visualization**:
- The indicator plots the M2 Index as a line chart.
- Key reference levels are highlighted:
- **10% (Red Line)**: Oversold level (low liquidity).
- **50% (Black Line)**: Neutral level.
- **80% (Green Line)**: Overbought level (high liquidity).
---
### **How to Use the Indicator:**
#### **1. Understanding the M2 Index:**
- **Below 10%**: Indicates extremely low liquidity, which may signal economic contraction or tight monetary policy.
- **Above 80%**: Indicates high liquidity, which may signal loose monetary policy or potential inflationary pressures.
- **Between 10% and 80%**: Represents a neutral to moderate liquidity environment.
#### **2. Trading Strategies:**
- **Long-Term Investing**:
- Use the M2 Index to assess global liquidity trends.
- **High M2 Index (e.g., >80%)**: Consider investing in risk assets (stocks, commodities) as liquidity supports growth.
- **Low M2 Index (e.g., <10%)**: Shift to defensive assets (bonds, gold) as liquidity tightens.
- **Short-Term Trading**:
- Combine the M2 Index with technical indicators (e.g., RSI, MACD) for timing entries and exits.
- **M2 Index Rising + RSI Oversold**: Potential buying opportunity.
- **M2 Index Falling + RSI Overbought**: Potential selling opportunity.
#### **3. Macroeconomic Analysis**:
- Use the M2 Index to monitor the impact of central bank policies (e.g., quantitative easing, rate hikes).
- Correlate the M2 Index with inflation data (CPI, PPI) to anticipate inflationary or deflationary trends.
---
### **Key Features:**
- **Customizable Timeframe**: Adjust the lookback period (e.g., 13 weeks, 26 weeks) to suit your trading style.
- **Multi-Economy Data**: Aggregates M2 data from the US, EU, China, Japan, and the UK for a global perspective.
- **Normalized Output**: Converts raw M2 data into an easy-to-interpret percentage format.
- **Reference Levels**: Includes key levels (10%, 50%, 80%) for quick analysis.
---
### **Example Use Case:**
- **Scenario**: The M2 Index rises from 49% to 62% over two weeks.
- **Interpretation**: Global liquidity is increasing, potentially due to central bank stimulus.
- **Action**:
- **Long-Term**: Increase exposure to equities and commodities.
- **Short-Term**: Look for buying opportunities in oversold assets (e.g., RSI < 30).
---
### **Why Use the Global M2 Index Percentage?**
- **Macro Insights**: Understand the broader economic environment and its impact on financial markets.
- **Risk Management**: Identify periods of high or low liquidity to adjust your portfolio accordingly.
- **Enhanced Timing**: Combine with technical analysis for better entry and exit points.
---
### **Conclusion:**
The **Global M2 Index Percentage** is a powerful tool for traders and investors seeking to incorporate macroeconomic data into their strategies. By tracking global liquidity trends, this indicator helps you make informed decisions, whether you're trading short-term or planning long-term investments. Add it to your TradingView charts today and gain a deeper understanding of the global money supply!
---
**Disclaimer**: This indicator is for informational purposes only and should not be considered financial advice. Always conduct your own research and consult with a professional before making investment decisions.

Kinetik Model [NantzOS]Description:
The Kinetik Model is a strategy that reinterprets the traditional stochastic oscillator to take advantage of momentum instead of the standard overbought/oversold reversal approach. Primarily operating upon zero line crosses, what you observe is the difference between the K and D plots. the first unique feature about this system is that the stochastic calculation has been made "boundless" in order to more accurately gauge the rate of momentum. It doesn't consolidate in upper or lower channels. The second feature is the dataset typically known as %K smoothing is set to a fixed value, the %K length and %D smoothing serve as a customizable length and signal. The third is that it takes trades based on the difference between the fixed %K and customizable %D, a reminder that is your oscillator display. This oscillator versus the traditional stochastic is comparable to the MACD histogram versus the MACD line plots. The fourth feature is that the user dynamically tests the upper and lower thresholds, displayed with a color background on the oscillator, to act as a filtration method. The system won't take shorts if momentum is above the upper threshold and won't take longs if it's performing below the lower threshold. Lastly, this system uses a trailing stop exit strategy, which can be deactivated, and the option to test long only.
Features Summarized:
A reimagined stochastic that operates without fixed boundries, offering flexibility for properly observing momentum.
High and low levels act as extreme zones for highlighting strong trends.
Users can modify data length, signal input, and thresholds from the settings to suit their preferred asset and time frame.
A built-in optional stop-loss mechanism with adjustable sensitivity, enabling tighter or more relaxed risk management.
Includes and optional long only setting and candle coloring with signals.
How to Use:
Navigate to the indicator tab in TradingView to search and apply the Kinetik Model.
Access the settings icon on the indicator to navigate the style and settings:
Length: Modifies the amount of data used to calculate the oscillator.
Signal: Further calibrates the sensitivity of the final plot.
High/Low Thresholds: A single filtration method for defining extreme zones of momentum bias, which determines entry/exits along with the zero line crosses.
Remaining Settings: Customize stop loss calibration along with optional features and styling choice.
Oscillators have been a staple in financial analysis since the mid-20th century, with tools like the RSI, MACD, and Stochastic helping gauge overbought and oversold conditions. What makes the latter unique is that the stochastic utilizes highs and lows as opposed to various EMA rates of change. Kinetik's unique boundless stochastic calculation and K/D difference plotting are the heart of this strategy.

Multiple Oscillator Conditions Final [siulian] v2This tool is created to gather multiple oscilators condition under the same umbrela and back-test your idea.
Basically the only intention of this tool is to used in combination with a back-tester indicator ( or manually ) where you get the entry based on the cumulative signals provided by this tool.
For example you can to combine RSI , MACD, CCI, Keltner Channels or whatever indicator you think it might give you an edge for an entry signal.
You can combine up to 7 indicators either by comparing them with a static value or with another indicator (for example you can compare RSI with RSI MA, Volume with Volume MA, etc)
There are two lines which will be printed.
1) Result(blue line) - it will print 1 when all the condition are met ( the same can be used for back-testing tools)
2) Condition Met count(yellow line) - which will count how many conditions from the ones selected are triggered ( for example you have 6 indicators that are matching the conditions and you still want to take a trade even if the condition number 7 is not met)
Alarms can be setup to check if more than defined conditions are present.
As a demo in the above image i have put several condition in order to possible catch bottoms.
Please understand this is just an example on how to integrate multiple condition into a single entity and should not be used as is.
1) price should close below KC
2) CCI < - 100
3) RSI < 30
4) Vol > Vol MA
Past performance do not guarantee future performance.

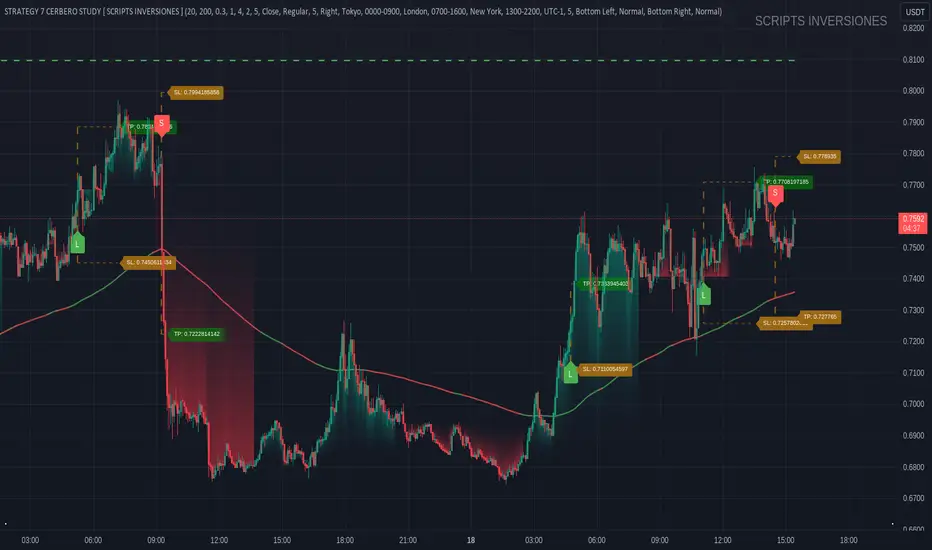
STRATEGY 7 CERBERO STUDY [ SCRIPTS INVERSIONES ]USE:
ADXCONFIG:
Purpose: Select the range for the strength required in the ADX for our alert condition. This setting allows traders to define the threshold at which the ADX indicates sufficient market momentum for trading decisions.
USETRENDLOGIC:
Function: Utilizes the trend EMA to make long entries when the price is above and short entries when it is below the EMA. This provides a simple, clear rule based on the relative position of the price to the EMA, facilitating trend-following strategies.
SELECT A VALUE FOR EMA:
Description: Choose the range for the EMA, and the alert conditions will be applied depending on whether the price is above or below when USETRENDLOGIC is activated. This allows for flexibility in setting the sensitivity of the EMA to price movements.
ACTIVATE/DEACTIVATE EMA 35 AND EMA 50:
Usage: These EMAs are used to determine the trend in shorter periods of time, providing traders with quick insights into market dynamics and potential trend shifts.
LOGIC 1:
ENABLE/DEACTIVATE STRATEGY 1/1:
Conditions: If the 1/1 strategy is activated, it will use the following setup:
Volume entry + EMA condition + BREAK
ADX > ADXCONF
DMI+/DMI- higher depending on the trend
Explanation: This strategy combines volume analysis with EMA and trend indicators to identify strong, actionable trading signals.
This image shows its use.
LOGIC 2:
ENABLE/DEACTIVATE STRATEGY 1/2:
Conditions: If the 1/2 strategy is activated, it utilizes:
Volume entry + EMA condition + BREAK
Purpose: Focuses on significant breaks in EMA levels with accompanying high volume, suggesting a strong momentum-backed entry point.
This image shows its use.
LOGIC 3:
ENABLE/DEACTIVATE STRATEGY 1/3:
Conditions: If the 1/3 strategy is activated, it involves:
Volume entry + EMA condition
RSI
ADX > ADXCONF and DMI+/DMI- higher depending on the trend
Utility: Combines volume, EMA, and RSI indicators with ADX strength to filter entries during extreme market conditions, enhancing the probability of capturing significant moves.
This image shows its use.
LOGIC 4:
ENABLE/DEACTIVATE STRATEGY 1/4:
Conditions: If the 1/4 strategy is activated, it incorporates:
Volume entry + EMA condition
RSI ABOVE/BELOW your EMA
Application: This strategy uses RSI levels in relation to an EMA to fine-tune entry points, helping to confirm momentum before entering trades.
This image shows its use.
LOGIC 5:
ENABLE/DEACTIVATE STRATEGY 1/5:
Conditions: If the 1/5 strategy is activated, it utilizes:
Volume entry + EMA condition
Function: A straightforward strategy that uses volume and EMA conditions to identify primary entry points, focusing on the basic elements of trend and momentum.
This image shows its use.
POI LOGIC (Point of Interest)
Activate/Deactivate 2/1 POI Strategy
When the 2/1 POI strategy is activated, it employs the following conditions to determine market entries:
Volume Entry + EMA Condition + POI TOUCHED + ADX > ADXCONF and DMI+/DMI- higher depending on the trend:
Volume Entry: Looks for significant volume as confirmation that there is enough interest at the current price level.
EMA Condition: A specific condition regarding the Exponential Moving Average (EMA) must be met, such as the price being above or below the EMA, depending on the anticipated direction of price movement.
POI Touched: The price must have touched a previously identified Point of Interest, indicating a level where the price has reacted before.
ADX > ADXCONF: The Average Directional Movement Index (ADX) must be greater than a set value (ADXCONF), indicating sufficient trend strength.
DMI+/DMI- higher depending on the trend: The Directional Movement Indicator Plus (DMI+) or Minus (DMI-) needs to be higher, depending on whether the trend is bullish or bearish, respectively.
This strategy is designed to capitalize on price levels where the market has shown previous reactions, using a combination of technical analysis and volume to confirm entry signals.
This image shows its use.
DIVERGENCE LOGIC
Activate/Deactivate Divergence Strategy
When the divergence strategy is activated, it employs the following conditions for making trading decisions:
Volume Entry + Divergence: This condition indicates that a market entry should be considered when there is a divergence between the price and a technical indicator (such as RSI, MACD, etc.), accompanied by significant volume.
Divergence occurs when the price of an asset moves in the opposite direction of the technical indicator, which may suggest a potential reversal in market trends. Volume plays a crucial role here, as high volume during a divergence can confirm the strength of the potential trend reversal.
This strategy aims to capitalize on moments when the market shows signs of exhaustion in a trend and is potentially gearing up to reverse, making divergences a key component in anticipating significant movements.
This image shows its use.
FOREX LOGIC
Activate/Deactivate FOREX Strategy
When the Forex strategy is activated, it uses the following conditions to execute trades:
Volume Entry + DI+ > DI- for long entries: This condition means that to consider a long position (buy), the Positive Directional Indicator (DI+) must be greater than the Negative Directional Indicator (DI-). This suggests that the market trend is moving upward, supported by sufficient trading volume backing this direction.
DI- > DI+ for short entries: For short entries (sells), the required condition is that the DI- (Negative Directional Indicator) is greater than the DI+ (Positive Directional Indicator). This indicates that the market trend is downward and that there is adequate volume confirming this bearish trend.
These conditions ensure that market entries are made with a clear confirmation of market direction based on volume and directional movement, which is crucial for increasing the probabilities of successful Forex trades.
This image shows its use.
ICT STUDY
Activate/Deactivate Strategy ICT
USAGE:
We use all these components in our indicator to provide comprehensive and effective control when trading using the ICT (Inner Circle Trader) methodology. Each element aids in visualizing and anticipating market movements more accurately, facilitating informed and strategic decision-making.
POI (Point of Interest): Used to identify critical points where the market has shown significant past activity, offering clues on potential future price reactions.
Imbalances: Crucial for spotting areas where supply or demand has been lacking, suggesting potential entry or exit points based on trend reversal or continuation.
ZigZag: Helps to eliminate market noise, allowing for clear identification of significant highs and lows, vital for trend analysis and reversal.
Supports and Resistances: Fundamental in determining price levels at which the market might stop or reverse, essential for any trading strategy.
Fibonacci: Utilized to find support and resistance levels based on mathematical proportions that naturally occur in markets, informing potential areas of interest.
Inducement: We observe these patterns to identify moments when price manipulations might be occurring, helping to avoid traps and enhance entries.
Sweep: Analyzed to understand how and where major market players are clearing accumulated orders, which can indicate significant price movements.
CHOCH (Change of Character): Used to detect a shift in price behavior, which may signal a reversal or trend change.
BOS (Break of Structure): Key for detecting when the price breaks through significant structures, suggesting changes in market direction.
Forecasting Length: Determines how far the price may reach into the future based on current analysis, crucial for planning long-term trades.
This image shows its use.
IF USE TP AND SL
TTP PNR filterPNR filter uses the "percentile nearest rank" method to produce signals from any source including oscillator indicators and price bars.
Features:
* Length - how many candles back in time to use for calculating PNR
* % low and high - what range of the spread of values captured will form the PNR band. Use 99&100 to create a band on the 1% highest percentile or 0&1 to create a band in the lowest percentile. It accepts float numbers so you can find very rare occurrences.
* src - by default it will use the close price but PNR filter can be used with any source. It's particularly useful when working with oscillators like RSI, MACD, ADX, etc.
* Signal direction - The indicator will print 1 when the selected conditions are met. Once the PNR band is plotted you can chose from cross over, cross under, above and below conditions to trigger a signal.
* Signal source - the band consists in a % low and % high, this option allows you to pick which band will be used with the "signal direction" parameter.
Example configuration:
1) Select 200 as the length
2) Select % low 0 and % high 1
3) Add RSI to the chart and select it as the source parameter
4) Select signal direction cross over
5) Select signal source % high which corresponds to the 1% band
In this setup you are finding values of RSI that in the past 200 candles have been that low only 1% of the time. With each new candle the calculation window will move as well leaving the oldest candle out.

MKAST-IndexThis is one of my free for all Indicators.
The TJ-Index is something I have been working on for quite a while and always was wanting to have on my charts, yet it took me longer than expected to finally finish it.
Now it is done and you can simply favourite this script and add it to your chart.
It is made out of 2 main parts.
Part 1:
15 Indicators and conditions like
-Delta MACD,
-Crypto Indicator,
-RSI,
-MACD,
-Momentum,
-CCI,
-OBV,
-Stochastic,
-CMF,
-Raw Buy and Sell Volume Domination,
-Super Guppy,
-Ichimoku,
-DIOSC,
-Volume Weighted MACD,
-Golden cross/Death Cross
Part 2:
The white line - the index itself.
So how this works is, you see 15 horizontal lines in green and red alternating, mentioned in that order above, if a bullish condition islet the horizontal line turn green, if it is a bearish condition, it is red.
The white index line, is basically depicting the number of bullish conditions at the same time.
I have seen that it is extremely powerful for divergences and especially thinking to take any position, checking if the index is high or low at the time.
An extra feature is that if ALL bullish or bearish conditions are met, the background of the oscillator will color itself green or red.
You can also turn on and off the horizontal lines for the easier user of the TJ-Index.
For now, the code will remain hidden, since I still have some important parts of this Index in my main Invite Only Indicator.
I will be publishing an open version of the TJ-Index soy ou can incorporate it in your own indicators.
Should you be interested in my main indicator or scripting work, feel free to DM me.

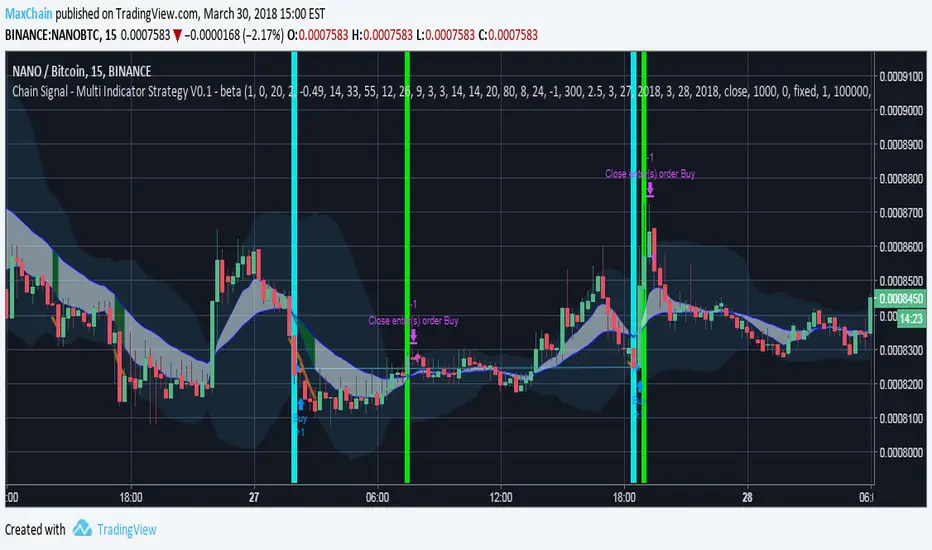
MaxChain Signals - Multi Indicator Strategy V0.1 - betaScript is under Construction:
Multiple Buy Strategies:
- RSI
- Stoch RSI
- MACD
- LOWBB
- EMAGAIN
Multiple Sell Strategies:
- RSI
- HIGHBB
- GAIN
Future Scope:
- Enable Trailing
- Smart DCA Strategies
- Williams Indicators
- Volume Indicators (longtrend / acutal trend)
- Signal Alerts for direct Buy Orders
Multi Signal RSI MACD HIgh Lo & indicator Macd BB SMA Heat BandsBuy and sell signal and indicator Macd BB SMA Heat Bands
30M Scalping Strategy with Debug LogsWhat’s changed
Spot‑only: all short logic removed—only long entries and exits are generated.
Logging: uses log.info() to send entry/exit details (timestamp, price, ATR, RSI) to the Pine Logs console.
Clean & concise: core scalp logic (EMAs, RSI, MACD, volume, ATR SL/TP) remains intact.

SKT's Volume Weighted Ichimoku Conviction Candle ColoringOverview
This indicator is a customized, volume-weighted variation of the classic Ichimoku Kinko Hyo system, designed to provide traders with an "at-a-glance" visualization of trend conviction and exhaustion. It overlays dynamic candle coloring on your chart, using a smooth gradient from deep green (strong bullish conviction) to gray (neutral or exhausted) to deep red (strong bearish conviction). The colors are driven by a composite score (-10 to +10, displayed as -100% to +100% strength), which quantifies probabilistic bias based on historical Ichimoku patterns, normalized for volatility and enhanced with volume dynamics.
Unlike standard Ichimoku, this version emphasizes "conviction strength" through gradients, helping identify not just trends but their reliability—e.g., fading colors signal potential reversals or pullbacks. It's particularly suited for trending assets like BTC/USD on daily or higher timeframes, where volume-weighted adjustments make lines hug price action during high-participation moves.
Key Benefits
Visual Heat Map: Candles shift colors based on score intensity, making it easy to spot weakening trends (pale shades) or strong continuations (deep shades).
Exhaustion Detection: Incorporates slope flattening, volume divergences, and cloud thinning to proactively desaturate colors near potential turns.
Strength Box: A persistent top-right label shows current % strength (e.g., "+75% Bull"), synced to the candle gradient for quick reference.
Adaptability: Works on any timeframe/asset; inputs allow tuning (e.g., for crypto's 24/7 volatility).
How It Works
The indicator computes a conviction score per bar, ranging from -10 (max bearish) to +10 (max bullish), then maps it to candle colors and a % strength display. The score is a weighted sum of five factors (total 100%), each normalized by ATR for scale-invariance:
Base: Normalized Price-Cloud Distance (40% Weight): Measures how far price is above (bullish) or below (bearish) the cloud. Calculation: Distance / ATR, clamped via tanh sigmoid for smoothness. Penalty: Fades score if distance <0.5 ATR (approaching cloud edge). Rationale: Large separations historically predict ~60-70% continuation; proximity hints at reversals.
Cloud Thickness & Color Alignment (15% Weight): Thickness = |Senkou A - B| / ATR; compared to SMA average. Boost if thick (>average: up to +3); penalty if thin (<0.5 average: up to -3). +1 bonus if cloud color aligns (green bull, red bear). Rationale: Thicker clouds act as stronger support/resistance; thinning signals exhaustion.
Other Lines: Chikou & Tenkan/Kijun Positions (15% Weight): Chikou distance from price/cloud ( / ATR): +4 if aligned far; -0.5 penalty if misaligned. Tenkan-Kijun separation ( / ATR): +3 if diverging (>0.5 ATR). Averaged for contribution. Rationale: Chikou confirms momentum from history; diverging lines indicate strength.
Exhaustion: Slope Calculation (Tenkan/Kijun) (15% Weight): Avg slope = (Tenkan linreg * 0.7 + Kijun linreg * 0.3) / ATR. Boost if steep (>0.2 abs: +3); penalty if flat (<0.1 abs: -3) or declining in trend (-4). Doubled if lines converging (<0.5 ATR sep). Rationale: Flattening/declining slopes detect fading momentum early.
Exhaustion: Volume Boost/Penalty (15% Weight): Dynamic thresholds: High = SMA(vol) + STD; Low = max(SMA - STD, 0). Boost if vol > high & slope aligns (up to +3). Penalty if vol < low or slope diverges (up to -3); skipped on new-bar first tick (barstate.isnew). Symmetric clamp: volContrib bounded ±3 to avoid spikes. Rationale: High aligning volume confirms conviction; low/diverging signals traps/exhaustion.
Score clamped ±10 overall. Gradients use RGB mixing: Deep colors for high abs(score), desaturated near 0 for smooth fades. Neutral bars vary gray shades by cloud thickness.
Inputs and Customization
All parameters are adjustable via TradingView's indicator settings:
Tenkan/Kijun/Senkou B Periods (9/26/52): Standard Ichimoku lengths; increase for smoother lines on volatile assets.
Displacement (26): Cloud shift; tweak for forward projection.
ATR Length (14): Volatility normalizer; longer for less sensitivity.
Slope/Volume/Thickness Lookbacks (5/20/20): Periods for slopes, vol SMA/STD, cloud avg—balance responsiveness vs. noise.
Scale Factor (2.0): Controls sigmoid clamping sharpness; lower for more gradual scores.
For BTC/USD: Try 20/60/120 periods on 1H/4H for crypto's non-stop trading.
Usage Instructions
Add to your chart via TradingView's Indicators menu.
Interpret Gradients: Deep Green: Strong bull (>+70% strength)—ride trends. Pale Green: Weakening bull (~+20-50%)—watch for exhaustion. Gray: Neutral (inside cloud)—avoid directionals. Symmetric for reds (bearish).
Strength Box: Top-right label shows live % (updates per tick).
Combine with: RSI/MACD for reversals (e.g., RSI divergence + pale gradient = potential turn).
Timeframes: Works on all; daily+ for best results. Test settings per asset/TF.
Notes and Disclaimer
- Performance: Backtest on your assets—score aligns with ~60% historical continuation in strong trends, but markets are unpredictable.
- Limitations: Volume-sensitive on low-TF or illiquid assets (fixed with clamps/barstate.isnew); no built-in alerts (add via TradingView).
- Disclaimer: For educational purposes only—not financial advice. Past performance ≠ future results; use with risk management.
